What’s a Siamese network? The magical flower that can detect demons!
this comic is a non-technical introduction to the idea of the Siamese network, when the fairies are talking about a magical flower that can detect demons
The fun you can't miss!
this comic is a non-technical introduction to the idea of the Siamese network, when the fairies are talking about a magical flower that can detect demons
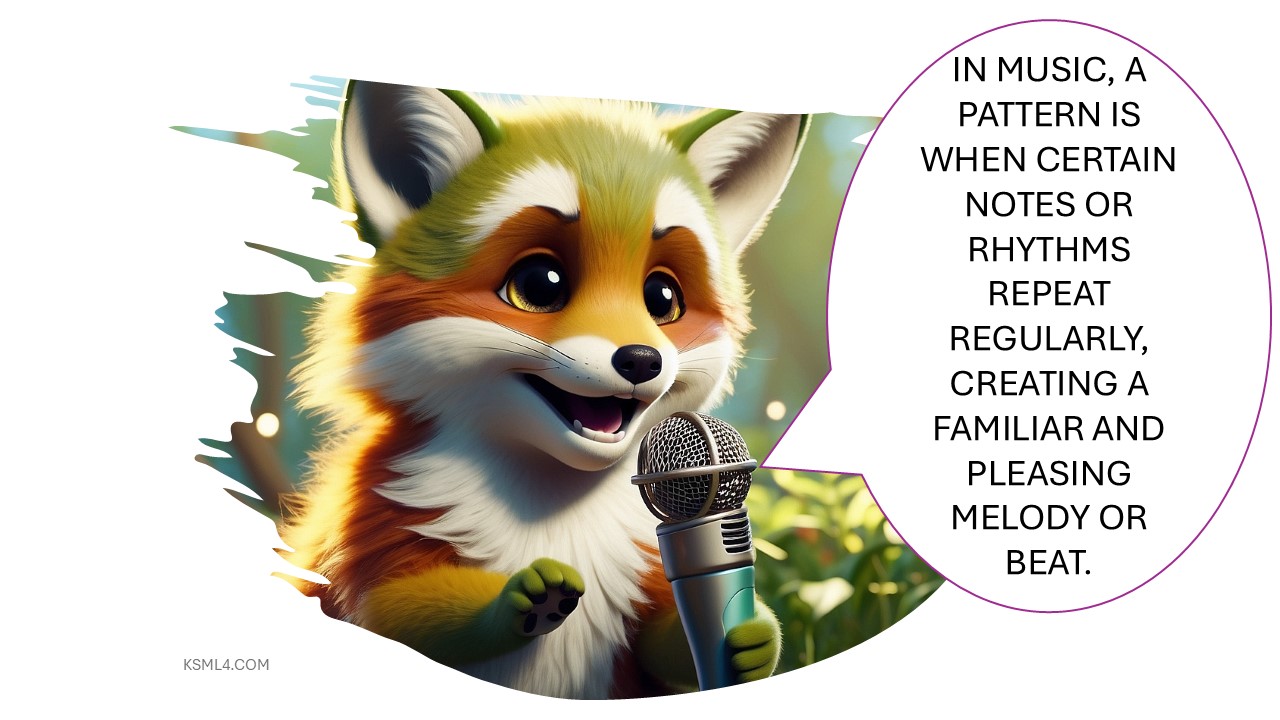
This cute, funny comic helps us to understand what a pattern is. Data analysis relies on identifying patterns such as trends, cycles, and clusters to extract insights. Trends provide long-term behavioral insights influencing business strategies, while cycles help optimize operations during seasonal fluctuations. Clusters reveal relationships within data, enhancing decision-making.
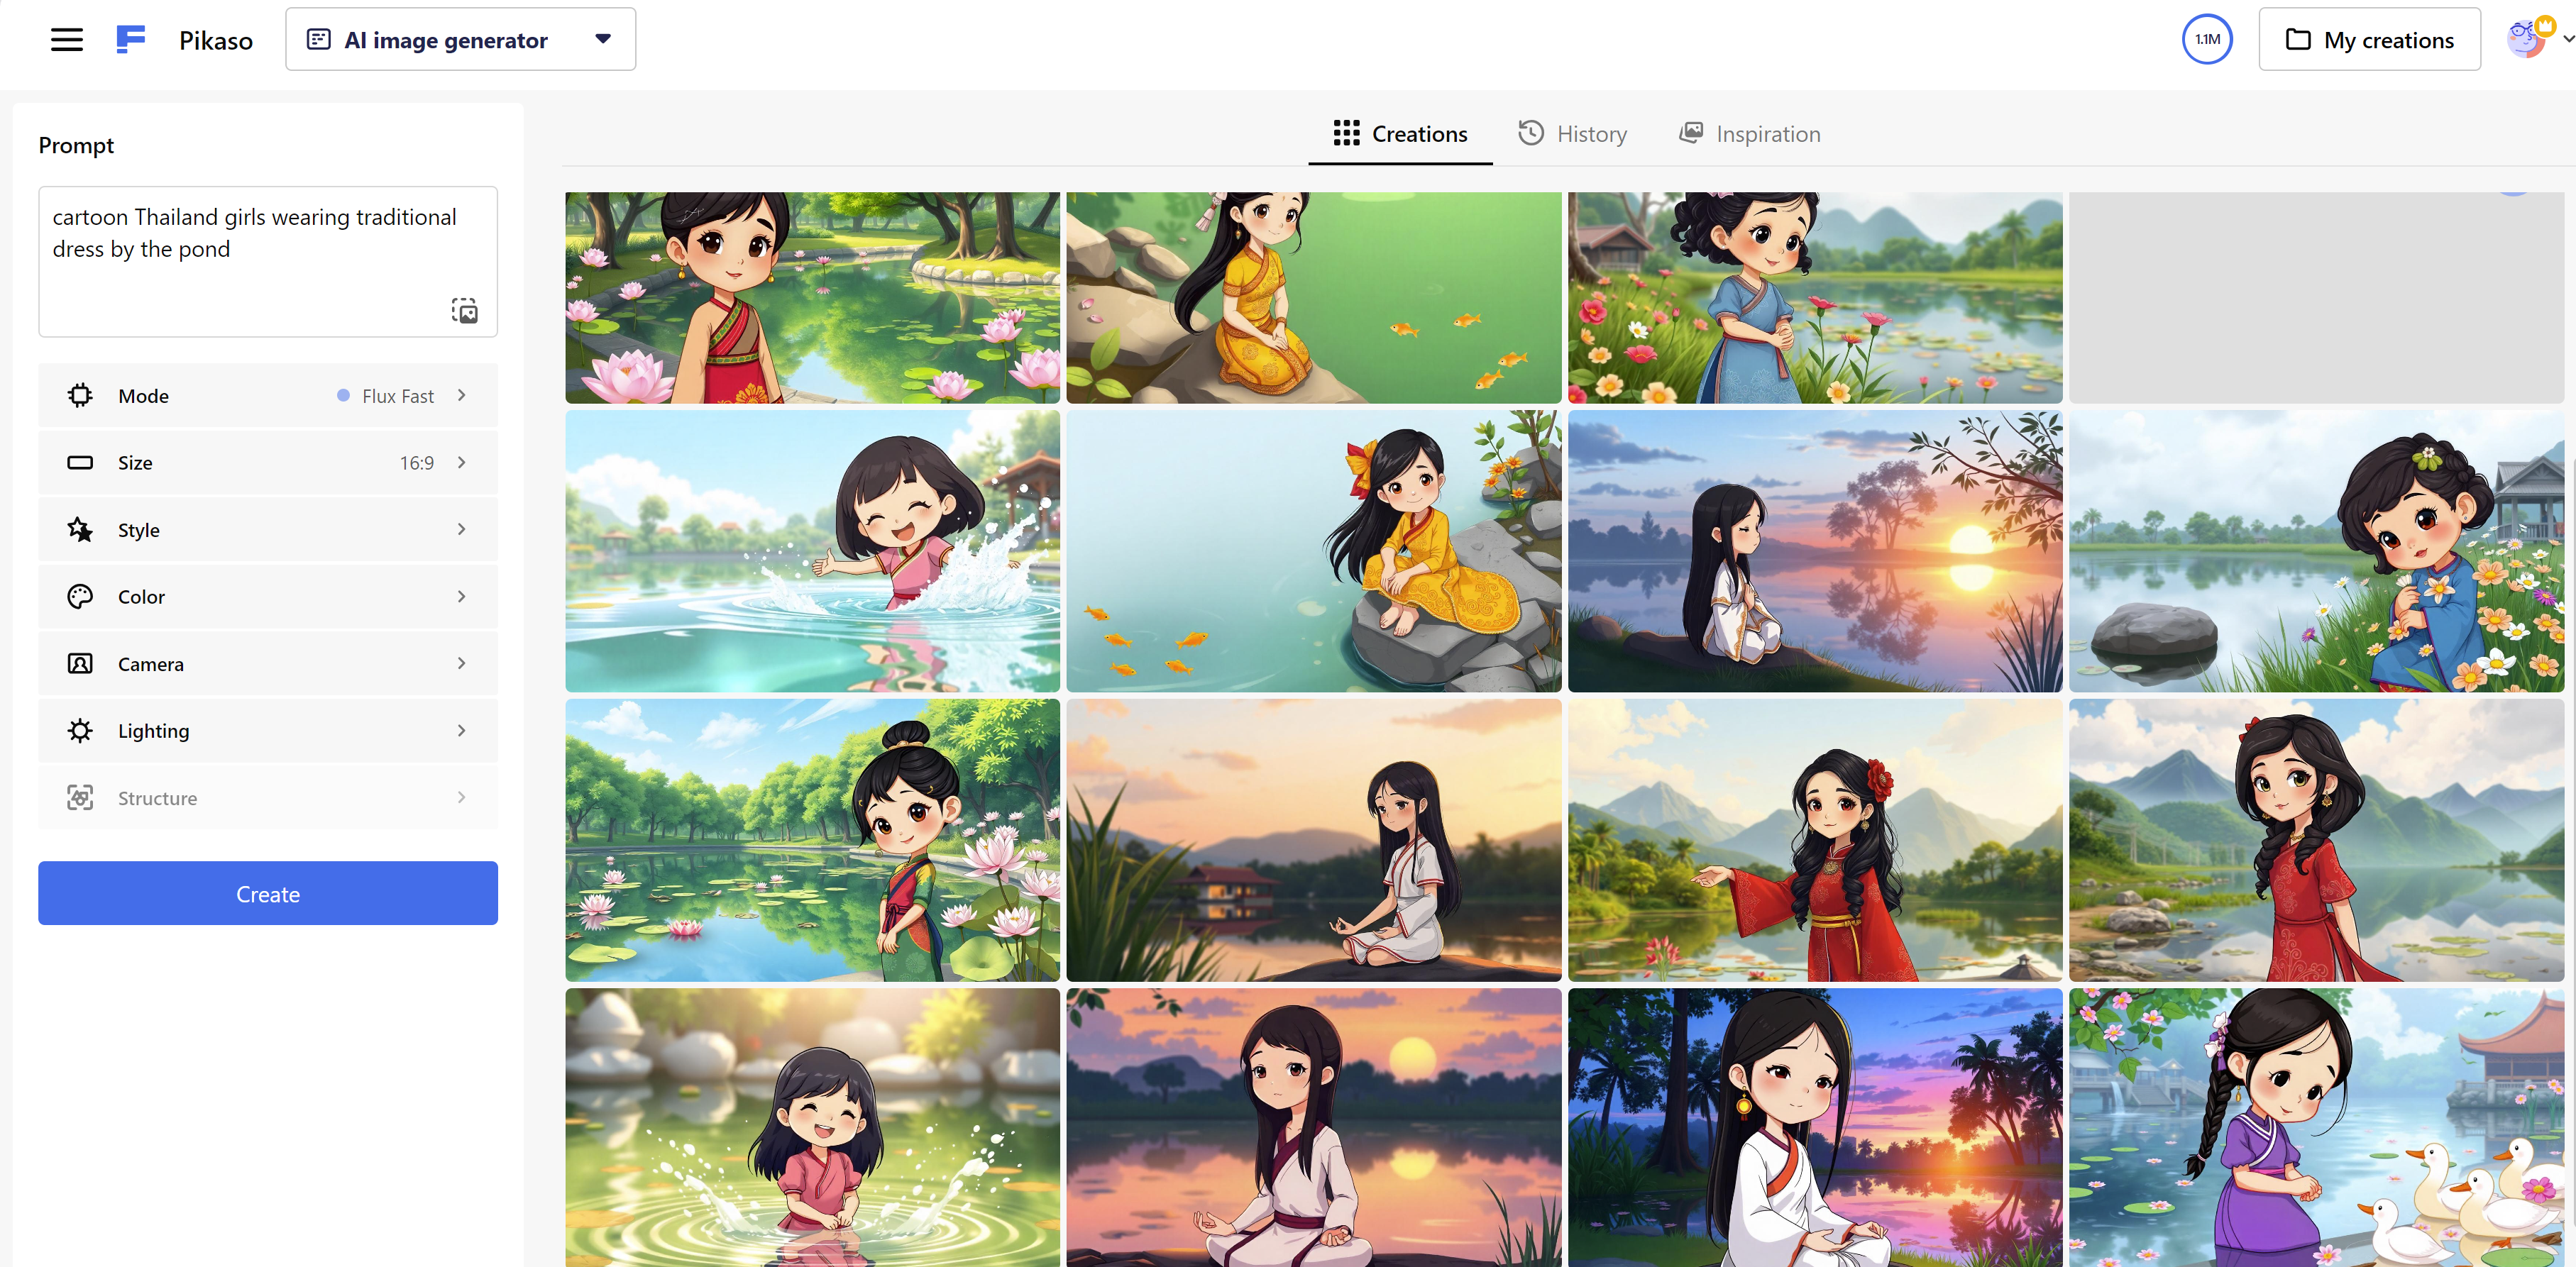
In this experiment, I used Pikaso to generate 20 images with a provided command, with “AI prompt” on (that means…
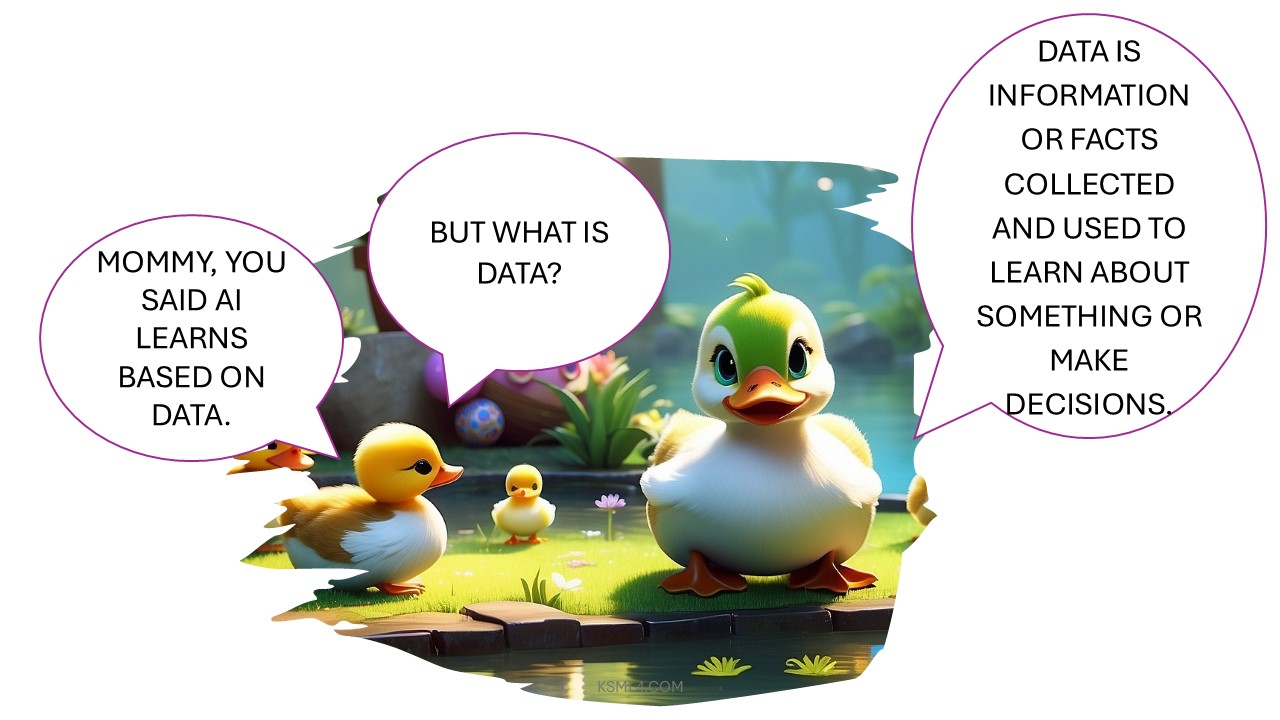
This funny comic about the duck family introduces what is data and surveying. Data comprises various forms of information, such as numbers and text, collected for analysis. Surveys are effective tools for gathering opinions and preferences, enabling better decision-making by capturing diverse insights quickly. They facilitate understanding of collective preferences, helping individuals, businesses, and organizations make informed choices based on real feedback.
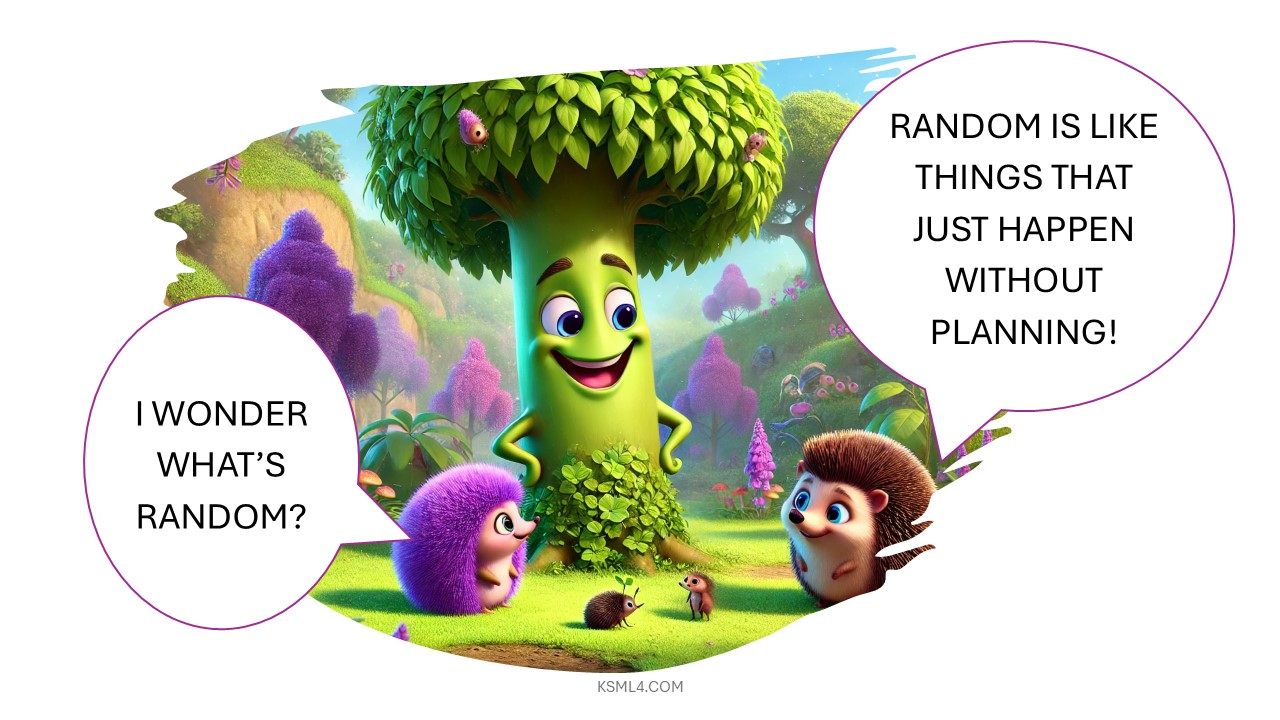
Randomness is vital in various domains, enhancing decision-making, creativity, and research. It fosters innovation while underpinning cryptographic security and statistical sampling, ensuring unbiased data collection. By promoting equal selection chances, randomness strengthens conclusions and generalizations, …
This cute funny comic features self-driving cars and patterns. Self-driving cars operate autonomously using advanced technology like sensors and AI to navigate. They aim to enhance road safety, reduce traffic congestion, and improve mobility by analyzing patterns in their surroundings, enabling efficient decision-making.
This cute and funny comic about bats and owls features misclassification and applications of classification. Misclassification occurs when a model wrongly categorizes data, leading to consequences like financial loss and safety risks. Classification applications span healthcare, finance, marketing, image and speech recognition, and natural language processing, enhancing decision-making and efficiency.
This cute, funny comic about the zebras and chihuahuas helps us understand what classification is. Classification systematically organizes entities into categories based on common traits, enhancing identification and analysis across various fields, including biology and library science, facilitating knowledge organization, retrieval, and effective communication in research and decision-making.
This cute comic helps to understand what an algorithm is. An algorithm is a structured set of instructions aimed at completing a task or solving a problem. It can range from basic tasks, like sorting, to complex AI systems, and is essential in various fields, including technology and science.
Machine learning enables computers to learn from examples, improving their abilities to understand user preferences, such as suggesting games or shows. It is applied in diverse fields, including healthcare diagnosis, autonomous driving, and retail, enhancing efficiency and user experience in daily tasks.